

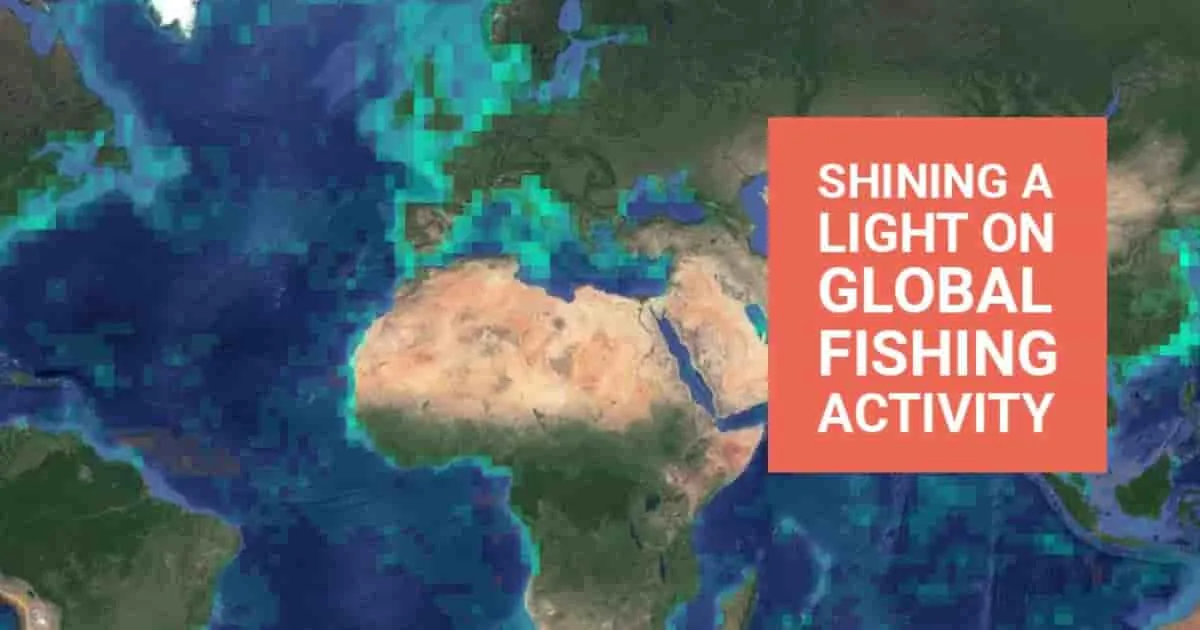

Human activity at sea
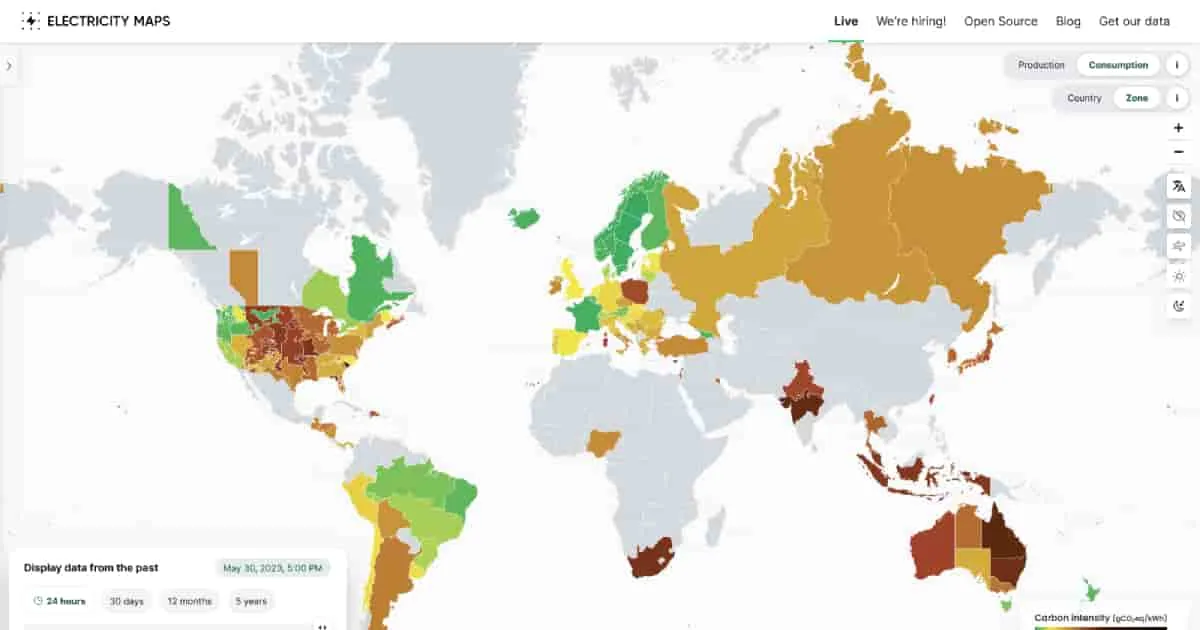
This site is a live 24/7 visualization of where your electricity comes from and how much each country consumes, which is reflected based on color. The darker the color, the more carbon is being used and ultimately contributing to climate change.
More like this
Human activity at sea
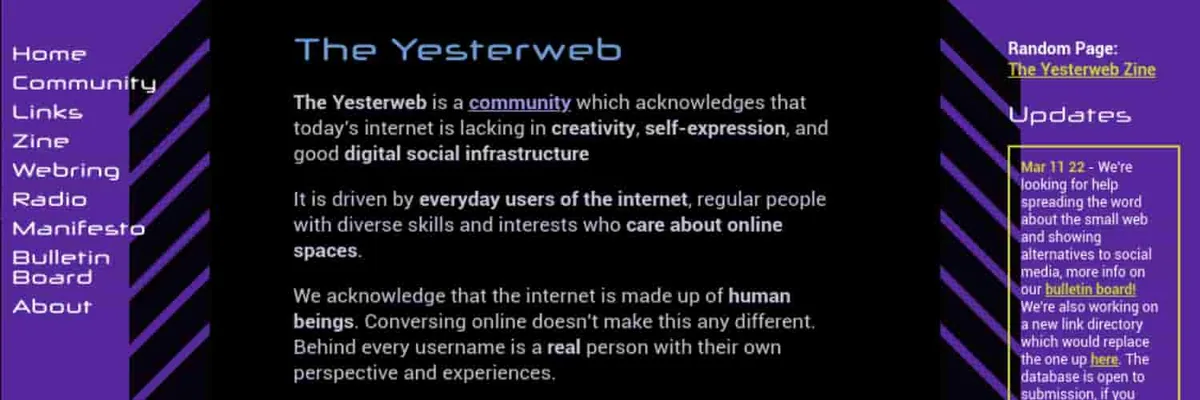

Reclaiming the Internet


What’s your water footprint?


Plant some knowledge in your kids
Different direction?
Something else. The internet has more than one rabbit hole.